


Introduction
When security leaders present their identity and access management (IAM) progress, the reports are often full of activity counts, including accounts provisioned, tickets closed, or access reviews completed. In my experience, these volume-based IAM metrics rarely demonstrate real business value.
The main challenge comes when you need to justify identity investments to finance executives, CISOs, boards, and external auditors. They do not want to hear how busy your team is. What they want instead is a clear proof that access controls reduce organizational risk, eliminate operational friction, and protect the bottom line.
In this article, I examine which IAM metrics you should actually track and how to calculate them accurately. I will also share how to connect your technical results directly to operational efficiency, risk reduction, and demonstrable IAM ROI.
In a nutshell:
- Track outcome metrics, such as time-to-onboard and deprovisioning time, rather than activity counts.
- Calculate IAM ROI over 3 to 5 years: (total benefits − total costs) ÷ total costs × 100.
- Keep hard savings, released capacity and risk reduction separate so finance can verify each one.
What are IAM metrics and KPIs, and why do they matter?
IAM metrics measure how effectively an organization manages digital identities and access. IAM KPIs, on the other hand, are the specific metrics you select to track progress toward actual business, security, or compliance goals.
The real difference comes down to activity versus outcomes. Tracking the number of accounts provisioned only tells you how much work got done. A true KPI – like the median time from a new hire’s start date to full access – measures an outcome. It shows how fast your identity setup actually enables someone to work.
In my experience, identity metrics must reflect business priorities rather than operational volume alone. When you track access management through risk reduction and onboarding speed, leadership can see where controls work and where delays hold the business back.
Which IAM metrics should organizations measure?
The 13 IAM metrics at a glance:
| Metric | How to measure it | What finance sees |
| Time-to-onboard | Median and P95 time from HR start to full role access | Faster productivity, less IT effort |
| Access-request SLA | Median, P95 and % fulfilled within SLA | Predictable service delivery |
| Automated vs. manual access | Automated lifecycle events ÷ eligible events | Manual work avoided |
| IAM/help-desk tickets | Avoided tickets × handling time × hourly cost | Support cost saved |
| IT hours saved | Task hours before vs. after automation | Released capacity |
| Licenses reclaimed | Reclaimed licenses × unit cost | Hard software savings |
| Deprovisioning time | Leaver event to full revocation (median, P95) | Shorter exposure window |
| Leavers deprovisioned within SLA | Leavers revoked within target ÷ all leavers | Offboarding control holds |
| Orphaned accounts | Ownerless accounts by age, privilege and share | Security gaps closed |
| Audit-preparation hours | Hours to gather and format evidence | Lower compliance overhead |
| Evidence-generation time | Request to validated proof (median, P95) | Faster audits |
| Recertification person-days | Total review hours ÷ working hours per day | Governance labour saved |
| Reviews completed automatically | Automated workflows ÷ eligible workflows | Less manual coordination |
IAM metrics for operational efficiency
1. Time-to-onboard
The first essential metric is time-to-onboard, which measures the total time elapsed from the initial HR start event until a new hire gains access to all critical applications for their role. Tracking both the median and the 95th percentile (P95) allows you to capture typical performance alongside extreme delays. Measuring this matters because prolonged onboarding stalls new hires and forces IT teams into endless manual provisioning. Reducing this timeframe delivers immediate business value through faster time-to-productivity for new employees and significantly lower IT administrative costs.
An e-commerce platform operator we worked with faced severe onboarding bottlenecks due to manual ticket chains across disconnected systems, including HR via Tibco, Active Directory, and Google Cloud. By deploying centralized MIM 2016 automated JML workflows and self-service portals, we converted these manual ticket chains into Day-1 automated provisioning. In general, mature identity architectures aim for an 80/20 automation target: fully automating 80% of standard onboarding flows while routing the remaining 20% of complex exceptions to automated manager approvals.
2. Access-request fulfilment SLA
Beyond initial onboarding, you should monitor your access-request fulfilment SLA. This tracks the median and P95 fulfilment times, as well as the percentage of access requests completed within your agreed service level agreements. Separating automated requests from those that need manual escalation exposes specific roadblocks in approval chains. Ultimately, it also reduces project delays and ensures predictable service delivery.
3. Percentage of access automated vs. manual
To measure systemic progress, evaluate the percentage of access automated versus manual. This metric calculates eligible lifecycle events completed automatically, helping you quantify manual interventions avoided and hours saved. Tracking this ratio proves whether your identity investments actually eliminate repetitive tasks, freeing up valuable IT capacity for strategic projects.
4. IAM/help-desk ticket volume
Finally, analyze your overall IAM and help-desk ticket volume against an established baseline, categorized by issue type and handling time. You can determine the financial outcome directly using a clear calculation: multiplying avoided tickets by average handling time and your loaded support cost per hour. Lowering ticket volume directly reduces operational support costs and prevents daily workflow interruptions across the organization.
IAM metrics for access risk and lifecycle management
To evaluate identity health, I always separate pure operational efficiency from access-risk controls. Measuring IT hours saved and licenses reclaimed quantifies financial ROI, but tracking deprovisioning time, offboarding SLA compliance, and orphaned accounts tells you whether access is actually removed before it turns into a liability.
5. IT hours saved
Calculating IT hours saved requires comparing the time spent on routine identity tasks before and after implementing automation. By drawing on time-tracking data, ticket volumes, and handling averages, you can clearly demonstrate released capacity to leadership or show exact labor-cost savings.
6. Licenses reclaimed
Equally important for financial health is tracking licenses reclaimed. This IAM KPI measures the total number of software licenses canceled or avoided right after deprovisioning or routine access reviews. Multiplying reclaimed licenses by their unit cost highlights immediate reductions in recurring software spend.
7. Deprovisioning time
When it comes to mitigating risk, deprovisioning time is critical. You need to track the exact timeframe between an employee’s departure event and the complete revocation of their access across all critical systems, keeping a close eye on the median, P95, and SLA compliance rates. Crucially, I always distinguish simple account suspension from full deprovisioning, as active application sessions and token persistence can leave doors open long after an account appears disabled.
I heard about a case where a former employee at a company retained access to a corporate e-commerce account for two years after leaving. Because the platform sat completely outside centralized IAM metrics and directory workflows, nobody revoked access or unlinked the corporate credit card. This allowed the ex-employee to make private purchases on the company’s dime unnoticed. It is a classic illustration of why offboarding timelines must cover third-party and non-directory platforms.
8. Percentage of leavers fully deprovisioned within SLA
To ensure this does not happen systematically, monitor the percentage of leavers fully deprovisioned within SLA. Calculate this by dividing the number of former employees whose access was completely revoked within your target window by the total number of leavers. Validating this completion through immutable system logs ensures your offboarding controls hold up consistently across every platform.
9. Orphaned accounts
Finally, you must audit orphaned accounts, i.e., active accounts that lack a valid user, an accountable owner, or a documented business purpose. You should track their age, privilege levels, and proportion relative to your overall account population, excluding legitimate service accounts that have verified ownership.
In a large enterprise discovery engagement, we uncovered 12,000 Active Directory groups where only 200 had an assigned owner. Over 11,000 groups were undocumented “orphans” that required extensive reverse engineering before any migration could take place. Cleaning up orphans at this scale usually means fixing the role model behind them, which is why RBAC models break in large enterprises.
By tracking these IAM KPIs, you maintain clear account ownership, validate IAM ROI, and close dangerous security gaps before former employees or unmanaged accounts create an incident.
IAM metrics for audit readiness and access governance
Compliance audits often drain far more resources than necessary. To evaluate how easily an organization proves its control environment, I measure how quickly teams deliver evidence without manual friction or wasted effort.
10. Audit-preparation hours
The first key metric is audit-preparation hours, which tracks the total time teams spend to gather, validate, and format evidence. When you compare equivalent audit cycles over time, a steady drop in preparation hours directly proves reduced compliance overhead.
11. Evidence-generation time
Alongside overall preparation, track evidence-generation time. This measures the exact timeframe between an authorized request and the delivery of validated proof. Monitoring median and P95 delivery times pinpoints where manual reconciliation causes unnecessary delays.
12. Recertification person-days
To gauge access review efficiency, calculate recertification person-days. Divide the total hours spent across preparation, manager reviews, escalations, and remediation by standard daily working hours. Following access recertification best practices helps streamline these steps and remove manual overhead.
Here’s what efficiency looks like in practice. In one project we took part in, streamlined access certification workflows reduced total review effort from 149 to 55 person-days, which was an immediate 63% reduction in governance labor.
13. Percentage of reviews completed automatically
Finally, measure the percentage of reviews completed automatically. Calculate the eligible review workflows executed without manual coordination against total workflows. Pair this rate with total review duration and actual permissions revoked to ensure fast, accurate access removal.
How do you calculate IAM ROI and prove business value?
IAM ROI (%) = [(Total Benefits − Total Costs) / Total Costs] × 100, calculated over a 3 to 5 year horizon.
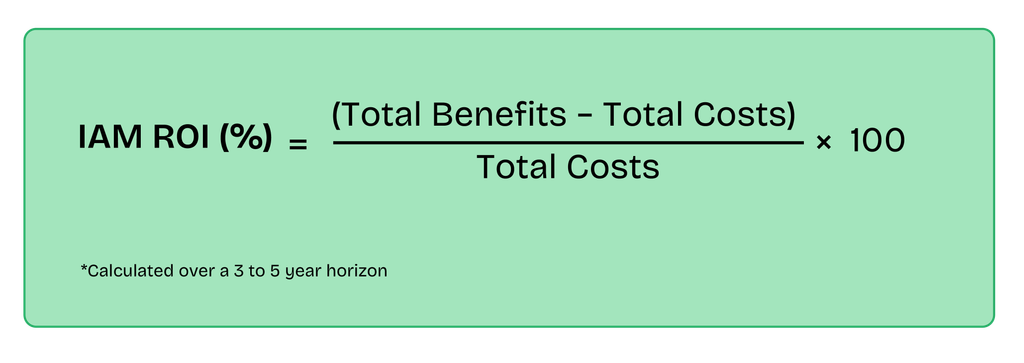
To convince leadership, you must connect operational wins – like fewer help-desk tickets or faster onboarding – directly to bottom-line savings and risk reduction.
1. Establish a solid baseline
Before you can measure return, you need a clear baseline. Record your current state across critical processes like provisioning times, ticket volumes, administrative hours, software license spend, and audit-preparation effort.
I recommend tracking these operational figures over a representative period, normalized for workforce size and application count. If your company grows by 20% during a migration, overall ticket volume might stay flat even as individual effort drops. Normalizing data prevents company growth or changing workloads from distorting your comparison.
2. Translate IAM improvements into financial value
Once you collect operational performance data, convert those efficiency gains into cash value using fully loaded labor rates.
Here are the primary formulas to calculate direct financial savings:
Support savings: Avoided tickets × average handling time (hours) × loaded hourly support cost
Labor savings: Verified hours saved × loaded hourly labor cost
License savings: Reclaimed licenses × avoidable unit license cost
Governance savings: Person-days saved per review cycle × cost per person-day × annual cycles
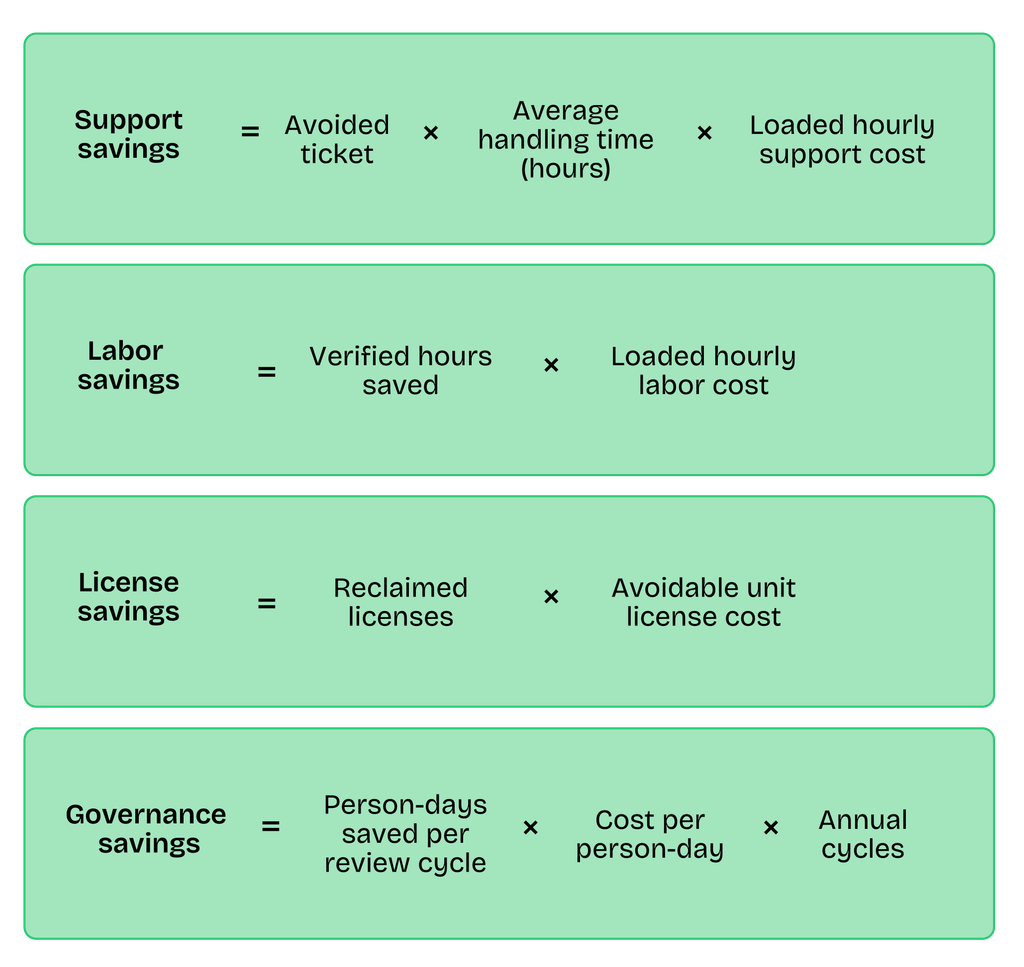
Always separate hard budget reductions (e.g., canceled software subscriptions) from released capacity (e.g., IT staff spending fewer hours on manual resets). Released capacity frees up valuable engineering time for strategic projects, but it does not reduce payroll expenditure directly.
Similarly, treat risk reduction separately unless you rely on a vetted, defensible loss-model. Preventing a breach carries massive value, but hard efficiency savings build a far more predictable business case.
3. Compare benefits with investment costs
To calculate true IAM ROI, evaluate your cumulative benefits against total expenditure – including initial software licensing, implementation services, system integration, training, and recurring maintenance.
Use the above-mentioned, standard calculation across a defined horizon (typically 3 to 5 years):
IAM ROI (%) = [(Total Benefits – Total Costs) / Total Costs] × 100
IAM ROI example – step by step
Consider a mid-sized organization that automates access requests and quarterly access certifications:
Support impact: Automated self-service resets eliminate 600 support tickets annually. At 15 minutes per ticket and a loaded support rate of $45/hour, this yields $6,750 in annual support savings.
Governance impact: Streamlined workflows reduce quarterly access review effort by 8 person-days. At $500 per person-day across 4 annual cycles, this saves $16,000 per year.
In this scenario, these two adjustments generate $22,750 in recurring annual benefits. Comparing this ongoing return against initial rollout costs and maintenance fees gives executive stakeholders a transparent payback timeline and concrete proof of business value. For illustration, assuming $60,000 in first-year rollout costs, payback would take about 2.6 years ($60,000 ÷ $22,750).
How do you make IAM metrics defensible to a CFO or auditor?
To satisfy a CFO or an auditor, your IAM metrics must stand up to scrutiny. Broad estimates and high-level summaries will not hold up during a financial review or compliance audit. You must document the underlying data, methodology, and logic so that any reported improvement can be independently verified.
The standards that could apply here may include the likes of NIST SP 800-53 (access control and identification families) in the United States or the global ISO/IEC 27001:2022 Annex A controls 5.15 to 5.18 (access control, identity management, access rights).
1. Define exactly what each metric measures
You must explicitly define start and end events, inclusion criteria, denominators, and reporting windows for every IAM KPI.
For instance, if you measure deprovisioning time, state precisely when the clock starts – such as the exact timestamp of the HR termination event – and when it stops, which is the confirmed revocation of access across all in-scope applications. Never assume an IAM workflow trigger equals execution; your definition must account for failed, delayed, or manual downstream actions across secondary systems.
2. Use reliable data and document calculations
Every metric you report should trace back to an authoritative system of record. Rely on HR software for employment status, identity management logs for workflow execution, and target application logs for final access changes.
To ensure your figures are audit-ready:
- Retain raw source records, calculation scripts, timestamps, and exception logs so third parties can reproduce your findings.
- Reconcile identity records across systems regularly to spot missing logs or unmatched accounts.
- Report unresolved system gaps or unmonitored platforms directly as measurement limitations rather than omitting them.
3. Compare like with like
Consistency over time is what proves real progress. Maintain identical definitions and reporting windows across comparison periods so your conclusions remain valid.
When analyzing data, segment your metrics by application criticality, identity type (e.g., full-time employees vs. contractors), or provisioning path. For time-based metrics, always report the median and 95th percentile (P95) alongside standard averages. While an average can hide extreme outliers, the median shows typical operational performance, and the P95 highlights the severe delays that introduce risk.
4. Connect every KPI to a business outcome
Finance and audit teams rarely care about operational activity for its own sake. Reporting that your team processed thousands of access requests or automated 90% of review workflows does not prove value on its own.
Instead, frame your IAM ROI and performance metrics around tangible business outcomes:
Replace activity counts with proof of reduced manual effort, actual dollar savings, faster remediation, or verified risk exposure reductions. Rather than reporting high review completion percentages, show the reduction in total recertification person-days, faster completion cycles, and the actual number of unnecessary permissions revoked.
Cross-reference these outcomes with application audit logs and change tickets.
When you tie operational efficiency directly to verified control improvements, leadership receives actionable, audit-proof evidence of your program’s return on investment.
IAM metrics bridge technicalities with business objectives
Effective IAM metrics must connect operational data directly to business outcomes and risk reduction. Rather than measuring volume, focus on proving real value.
Start with a targeted set of IAM KPIs aligned with immediate priorities. Establish reliable baselines first, then expand your scorecard only when additional data supports clear financial or security decisions. To see how these metrics apply in your environment, talk to QWEY’s IAM team.
FAQ
What is a good IAM KPI?
One that measures an outcome rather than activity, such as median time-to-onboard or the percentage of leavers fully deprovisioned within SLA.
How do you calculate IAM ROI?
IAM ROI (%) = [(Total Benefits − Total Costs) / Total Costs] × 100, over 3 to 5 years, including licensing, implementation, training and maintenance.
How do you justify IAM investment to a CFO?
Baseline your current figures, convert efficiency gains into money using loaded labour rates, and keep hard savings separate from released capacity and risk reduction.
What is the difference between IAM metrics and KPIs?
Metrics measure how identities and access are managed. KPIs are the metrics you tie to specific business, security or compliance goals.